This blog’s link on Analytics-vidhya::
https://medium.com/@omegaghirmay/hypothesis-testing-steps-235d2670cad4?source=friends_link&sk=827339e301a69fca53904918cdd56bea
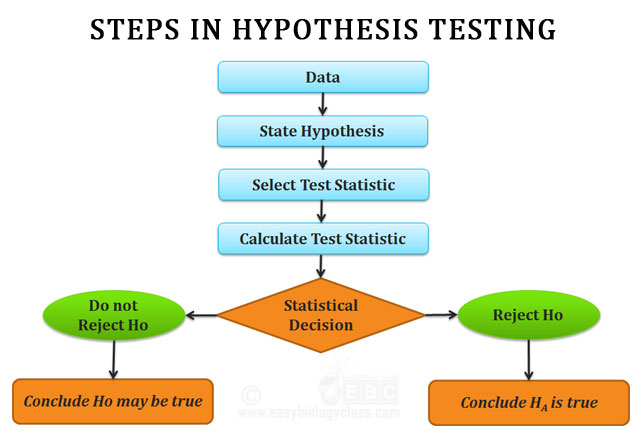
 Hypothesis testing is the process of using statistics to determine the probability that a specific hypothesis is true. It evaluates two mutually exclusive statements about a population to determine which statement is best supported by the sample data. The process of hypothesis testing consists of four main steps:
Step 1: Construct a Hypothesis
During this stage we formulate two hypotheses to test:
Null hypothesis (Ho): A hypothesis that proposes that the observations are a result of a pure chance and there is no effect relationship or difference between two or more groups.
Alternative hypothesis (Ha): A hypothesis that proposes that the sample observations are influenced by some non-random cause and there is an effect or difference between two or more groups. It is the claim you are trying to prove with an experiment.
Example: Sales discounts are a great way to increase revenue by attracting more customers and encouraging them to buy more items. Knowing the right way to give discounts will help the company to increase revenue. We are trying to see if a discount has an effect on the quantity of the orders and which discount has the highest effect. Let’s state the null and alternative hypotheses.
Ho: The average quantity of products ordered is the same for orders with and without a discount.
Ha: The average quantity of products ordered when a discount is given is higher than the orders without a discount.
The first thing you would do is calculate the mean quantity of the discounted products and the products without a discount. The question is, are we able to do this using the entire population? We rarely have the opportunity to work with the entire population of the data and most of the time we must obtain a sample that is representative of the population. In order to get a high-quality sample, we must check if these assumptions are satisfied.
Step 2: Set the Significance Level (α)
The significance level (denoted by the Greek letter α) is the probability threshold that determines when you reject the null hypothesis. Often, researchers choose a significant level of 0.01, 0.05, or 0.10, but any value between 0 and 1 can be used. Setting the significant level α = 0.01 means that there is a 1% chance that you will accept your alternative hypothesis when your null hypothesis is actually true.
For our example, we will set a significant level of α = 0.05.
Step 3: Calculate the Test Statistic and P-Value
Computed from sample data, the test might be:
T-Test: To compare the mean of two given samples.
ANOVA Test: To compare three or more samples with a single test.
Chi-Square: To compare categorical variables.
Pearson Correlation: To compare two continuous variables.
Given a test statistic, we can assess the probabilities associated with the test statistic which is called a p-value. P-value is the probability that a test statistic at least as significant as the one observed would be obtained assuming that the null hypothesis was true. The smaller the p-value, the stronger the evidence against the null hypothesis. Here is the python code to use for the welch’s t-test. The Github link for the entire project can be found here.
To run the t-test for our example, first, we need to import stats from Scipy.
 Step 4: Drawing a Conclusion
Compare the calculated p-value with the given level of significance α. if the p-value is less than or equal to α, we reject the null hypothesis and if it is greater than α, we fail to reject the null hypothesis.
In the above example, since our p-value is less than 0.05, we reject the null hypothesis and conclude that giving a discount has an effect on the quantity of the orders.
Decision Errors:
when we decide to reject or fail to reject the null hypothesis, two types of errors might occur.
Type I error: A Type I error occurs when we reject a null hypothesis when it is true. The probability of committing a Type I error is the significance level α.
Type II error: A Type II error occurs when we fail to reject a null hypothesis that is false. The probability of committing a Type II error is called Beta and is often denoted by β. The probability of not committing a Type II error is called the Power of the test.

Thanks for reading!
All of the code for this article is available here.
References:
https://www.easybiologyclass.com/hypothesis-testing-in-statistics-short-lecture-notes/
https://www.nedarc.org/statisticalHelp/advancedStatisticalTopics/hypothesisTesting.html
https://machinelearningmastery.com/statistical-hypothesis-tests/